Business Travel Super Simplified
Designed for businesses seeking flexibility and a wide range of choices




Travel and expense analytics helps businesses understand where their travel money is going and identify areas that need attention. By using spending, booking, compliance and expense data, it supports better monitoring, reporting and cost decisions, turning routine travel records into insights teams can actually act on.
Business travel generates data at almost every stage, from bookings and approvals to expenses, reimbursements and payments. Making sense of this information can help businesses understand where travel budgets are going and where processes may need attention. A 2025 report found that 81% of surveyed executives frequently use analytics to optimise travel and expense costs, while 77% use data to track policy compliance.
However, using travel and expense analytics effectively starts with tracking the right metrics. This article explores the key T&E metrics businesses should monitor and what they can reveal about their travel programmes.
| Add savings & convenience to your corporate travel! |
T&E analytics is the process of collecting, organising and analysing data generated throughout the business travel lifecycle. This includes information from bookings, approvals, flights, accommodation, ground transport, expense reports, reimbursements and corporate cards. By bringing this data together, businesses can identify spending patterns, monitor travel policy compliance and understand where costs are increasing or exceeding budgets.
It also helps finance and travel teams compare spending across departments, categories and time periods, giving them clearer insights for budgeting and decision-making. In short, T&E data analytics turns scattered travel records into insights that support more informed business decisions.
Businesses can collect hundreds of data points from travel bookings, expense claims, approvals and reimbursements. However, having more data does not necessarily make reporting more useful. The focus should be on selecting a manageable set of Key Performance Indicators (KPIs) that answer specific business questions.
Five core metrics provide a useful starting point for T&E analytics.
| KPI | What It Measures | Formula to Calculate |
| Share of spend by category | The proportion of total T&E spend going to flights, hotels, meals, transport and other categories | Category spend ÷ total T&E spend × 100 |
| Cost per trip by destination | Average travel expenditure for trips to a particular destination | Total T&E spend for destination ÷ number of trips |
| Policy-compliance rate | Percentage of transactions that follow defined T&E policies | Compliant transactions ÷ total transactions × 100 |
| Advance-booking lead time | Average number of days between booking and departure | Total days between booking and departure ÷ number of bookings |
| Supplier concentration | Share of spending directed towards particular suppliers | Spend with supplier ÷ total spend across all suppliers × 100 |
The five KPIs are a starting point, but their real value comes from analysing them together.
For example, an increase in total airfare expenditure does not necessarily mean that ticket prices have gone up. The organisation may simply have taken more trips. Or employees may be booking closer to departure, travelling to different destinations or using different suppliers.
By connecting total spend with cost per trip, booking lead time, destination and supplier data, businesses can dig into what is actually driving the change.
This is why KPIs should be defined before building a dashboard. A business should first decide what it wants to measure, agree on the calculation for each metric and determine what decisions the resulting information will support.
Once the relevant KPIs are defined, businesses can bring them together in a T&E dashboard.
A dashboard provides teams a visual way to organise the information generated through T&E data analytics. Instead of digging through separate spreadsheets for different categories, teams can use one reporting interface to view related metrics and investigate specific areas of spending. Building one can follow a few practical steps.
Decide what the dashboard should answer, such as total spend, cost per trip, policy compliance, booking lead time and supplier usage. These questions help determine which metrics belong on the dashboard.
Each metric should have a consistent definition, formula and reporting period. For example, cost per trip should be calculated the same way across departments if the figures are going to be compared. Agreeing on these rules upfront also stops different teams from interpreting the same metric differently.
The dashboard may draw information from travel booking platforms, expense systems, corporate cards, accounting software, HR systems and supplier records. Connecting these sources gives businesses a more complete view of travel expenditure, instead of analysing bookings and expenses in isolation.
Group related information into sections such as:
This structure lets users start with a high-level figure and then drill into the detail behind it.
A dashboard is only useful as its most recent update. Refresh the underlying data regularly, and make sure it’s clear how often each source, including bookings, expenses, corporate cards or accounting platforms, is syncing, so teams can trust the numbers they’re looking at.
| Unlock efficiency and savings for your business travel today! |
For businesses in India, T&E analytics can include metrics that provide additional visibility into GST-related documentation and domestic travel patterns. Three useful measures are:
Together, these metrics add an India-specific layer to T&E data analytics, helping businesses examine spending, tax-related information and travel patterns in one view.
Once businesses have visibility into their T&E data, the next step is using those insights to identify areas worth reviewing. This is what makes analytics a practical part of travel management. It helps businesses understand what is driving costs and where changes might be worth considering. Businesses can use the data to:
For example, a company finds that accommodation accounts for ₹15,00,000 of its annual T&E spend. Further analysis shows that ₹3,00,000 worth of hotel bookings are made outside the preferred booking window, with comparable rooms costing 5% less when booked earlier.
Potential difference = ₹3,00,000 × 5% = ₹15,000
This is an illustrative figure. The actual outcome would depend on availability, destination and booking conditions. But it shows how T&E data analytics can connect spending patterns with specific opportunities for review and support more informed travel management decisions.
Effective T&E analytics is ultimately about turning fragmented travel records into information businesses can act on. myBiz provides real-time T&E dashboards and reports out of the box, so teams can view relevant information as it becomes available. This makes analytics a more accessible part of day-to-day travel management, helping businesses move from periodic reviews to a more continuous way of understanding their business travel activity.
| Follow us on LinkedIn for business travel insights! |
Ans. Yes. Integrating T&E platforms with HR, finance or accounting systems can connect employee, transaction and financial information for more consistent reporting.
Ans. It can. When combined with itinerary and location data, analytics can flag high-risk destinations, frequent travellers and unusual travel patterns, supporting duty of care and cost control.
Ans. Ownership is often shared: finance typically owns overall spend and budget tracking, while travel managers own compliance and supplier metrics, with clear responsibility agreed in advance.
Ans. Benchmarking compares a company’s travel metrics, such as cost per trip or compliance rate, against industry averages or its own past performance to judge whether the results are strong or weak.
Related Blogs:
| myBiz - winning customer appreciation every time! |  |  |  |
Our features and benefits are curated to suit the needs of every employee using myBiz.
Who manages company's travel expense
Simplified Admin Panel to manage all employees and their expenses
Detailed reports on regular basis to keep a track on your spends
Dedicated Support Manager from myBiz to take care of your queries
Who books for employees
Book using the traveller's Policy to ensure the right options are booked
Shortlist & share travel options to employees directly from myBiz
Track your requests & get the job done from one single place
Who travel for business
Special Corporate Fares in flights to ensure you get more benefits at reduced price
myBiz Assured Hotels for top-rated stay options
Sanitized Cabs to safely pick & drop you to your destinations
Grab all the corporate benefits by creating your account now
Get started by providing minimal details like employee size, organisation name, etc.
Gain most of the benefits by setting up employee-friendly policies (only Admin users).
Invite your employees to myBiz so that they could enjoy all the corporate benefits.
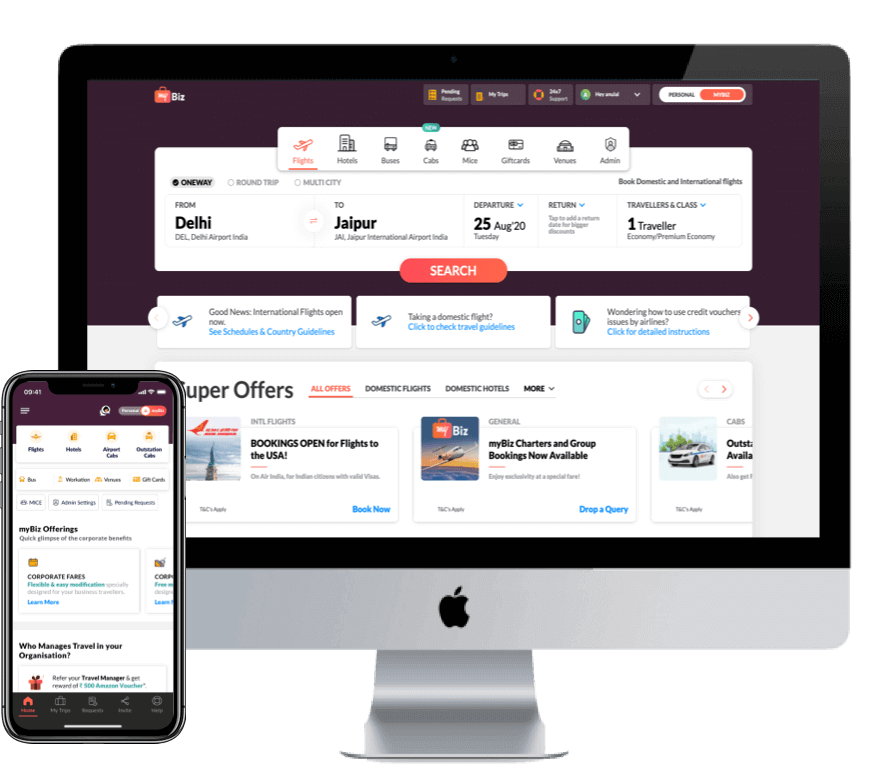
With our super intuitive and connected web application & mobile app, myBiz is always available to address all your business travel needs.




myBiz powers many of the small, medium & large size organisations to help them save on their travel budget and achieve more from their business travels. Read interesting stories from these organisations.